What is a Psychrometric Chart?
A Psychrometric chart is a diagrammatic representation of various processes of air. Psychrometric chart explains the different properties of air. The processes involved in psychrometric chart involve physical and thermodynamic properties like humidity, dry bulb temperature, wet bulb temperature, dew point, enthalpy, etc. There are few basic elements of the properties of air. The psychrometric chart displays all these properties.
Understanding how to read the psychrometric chart allows you to determine the elements required to change the various properties of air.
The various properties of air which can be determined on the psychrometric chart are:
- Dry Bulb Temperature
- Wet Bulb Temperature
- Enthalpy
- Dew Point
- Relative Humidity
- Humidity Ratio (Specific Humidity)
- Water Vapor Pressure
- Specific Volume
With the knowledge of any two points (properties), all the other properties can be calculated.
So let’s understand each of these properties in detail.
-
Dry Bulb Temperature:
Dry Bulb Temperature:
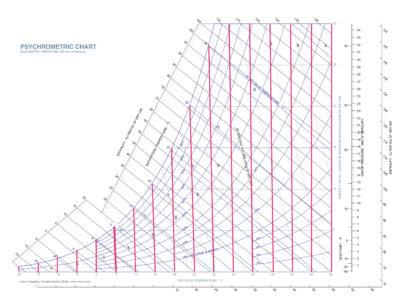
The dry bulb temperature is the temperature of the air determined by any ordinary thermometer. It is shown is Degrees Celsius or Degrees Fahrenheit.
The dry bulb temperature runs along the x-axis and is indicated by evenly spaced vertical lines.It is represented by vertical lines as shown below in the psychrometric chart.
-
Wet Bulb Temperature:
Wet Bulb Temperature:
In simple language, the wet bulb temperature is measured with a wet bulb i.e. a bulb which is wrapped in a wet cloth. As the water evaporates from the cloth, a cooling effect occurs.
The wet bulb temperature is the lowest temperature that can be reached by the evaporation of water only. It is the temperature you feel when your skin is wet and it is exposed to the moving air.
Therefore,
Wet Bulb Temperature < Dry Bulb Temperature.
But,
when, Humidity = 100% RH,
then,
Wet Bulb Temperature = Dry Bulb Temperature
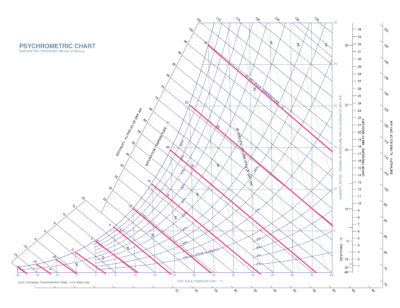
Wet Bulb Temperature is indicated by the lines that begin at the top of each dry bulb saturation temperature line and runs down towards the right at an angle of approximately 45 degrees celsius.
But, one thing to remember is that the distance between these lines increases as the dry bulb temperature increases. It is shown is Degrees Celsius or Degrees Fahrenheit.
It is represented in the psychrometric chart as below.
-
Enthalpy:
Enthalpy:
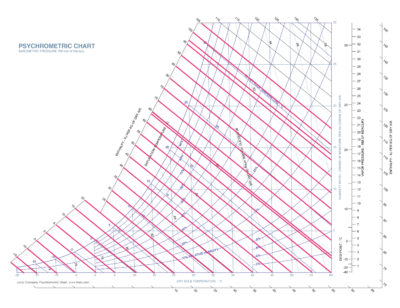
Enthalpy is the heat energy in the air. This is due to the sensible and latent heat.
For your understanding,
Sensible heat = Temperature of the air
and,
Latent heat = Moisture in the air
Enthalpy can be defined as the total energy in BTU’s of a sample of dry air and its water vapor. It can also be defined as the measure of specific, total heat measured in BTU’s per pound (lb) of dry air. Enthalpy cannot be measured directly, but the changes in it can be.
The enthalpy is shown above the saturation temperature in the psychrometric chart as given below. On the psychrometric chart, it is indicated by the bracketed numbers on the left.
The unit used for enthalpy is BTU per pound (lb) or, kiloJoules/kilogram (kJ/kg).
-
Dew Point:
Dew Point:
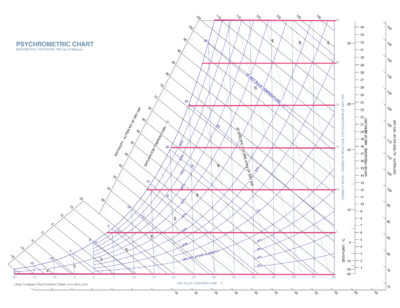
The dew point temperature is the temperature at which water vapor will start to condense out of moist air. “Dew” is formed because the air is saturated and can’t hold anymore water vapor. We can also say that the air which is fully saturated with moisture, has reached its dew point. This saturation or dew point temperature is indicated by the intersection of the dry bulb temperature and the far left curved line on the psychrometric chart. It is as given below. Dew Point Temperature is also known as the Saturation Temperature. It is shown is Degrees Celsius or Degrees Fahrenheit.
For example,
“FOG” is a real world example and representation of saturated air.
-
Relative Humidity:
Relative Humidity:
Relative Humidity is the amount of water the air can hold at a certain temperature. The ratio of the amount of moisture present in a sample of air compared to how much moisture the air could hold at that temperature.
Warm air can hold more water than cold air.
Relative Humidity is given as a percentage (%). It is the factor that determines how comfortable you feel at a specific dry bulb temperature.
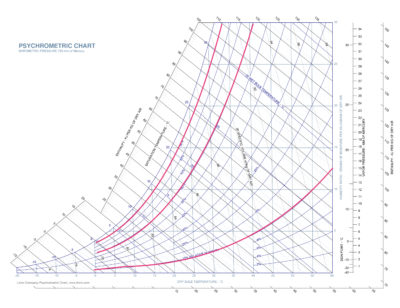
Relative humidity is denoted by the curved lines as shown below on the psychrometric chart.
For your understanding,
0% RH = Dry Bulb Temperature
100% RH = Wet Bulb Temperature
-
Humidity Ratio / Specific Humidity:
Humidity Ratio / Specific Humidity:
The humidity ratio is also known as the specific humidity.
In simple language, specific humidity or humidity ratio is the ratio of the weight of water in a sample of air to the weight of the same sample of air with no moisture in it (dry air).
It is measured in grains of water per pound (lb) of dry air, where 7000 grains is 1 pound.
Therefore,
Consider “a” = sample of air
then,
Humidity Ratio = Weight of water content in “a” / Weight of “a” with no moisture in it
or,
Humidity Ratio = grains of water / lb of dry air
where, 7000 grains is 1 lb
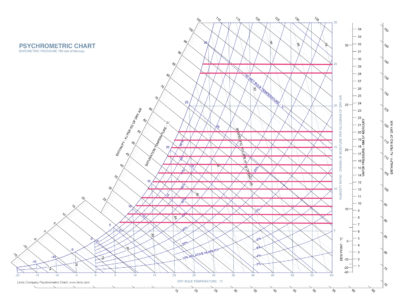
This ratio is called the specific humidity and is represented by evenly spaced horizontal lines along the y-axis on the psychrometric chart as shown below.
For example,
At 70 Degrees Fahrenheit and 30% Relative Humidity, the Humidity Ratio is 34 grains of water vapor per pound of dry air.
-
Water Vapor Pressure:
Water Vapor Pressure:
Water vapor pressure is the pressure exerted by the water vapor molecules on the surrounding environment, causing the air to move.
For Example,
When you open a door to an air conditioned space, water vapor pressure causes the moist air from the outside to be pushed inside.
Water vapor pressure is the “number of water vapor molecules per cubic meter”.
This is literally related to the absolute humidity.
The water vapor pressure affects the “evaporation rate”. When humidity in the air is high, the water vapor pressure is also high.
Hence, this is the reason why the evaporation rate in humid climate is very less.
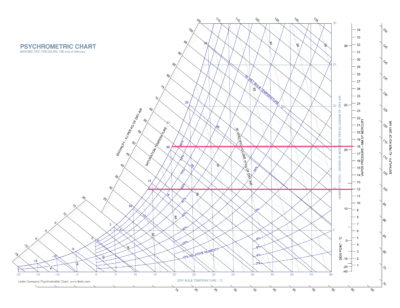
The water vapor pressure is measured in inches of mercury (0.2, 0.3, 0.4, and so on) and can only be seen in more complex versions. It has horizontal lines on the psychrometric chart and is shown on the far right parallel to the humidity ratio. To differentiate various lines, here we are using a simplified chart as given below.
For your understanding,
At 70 Degrees Fahrenheit and 50% Relative Humidity, the water vapor pressure represented in inches of mercury is = 0.37 “ Hg.
-
Specific Volume:
Specific Volume:
Specific Volume is the volume of space occupied by a pound (lb) of air. It is the volume that a certain weight of air is occupied under specific conditions.
It is measured in cubic feet per lb or cubic meter per kg of dry air.
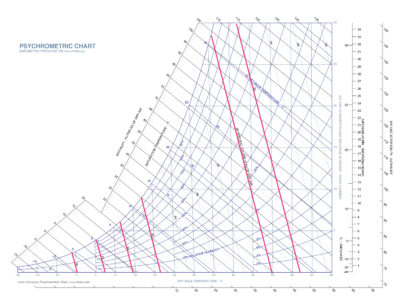
Specific Volume is shown in the below psychrometric chart which are equidistant from each other. These lines are in contrast to the wet bulb temperature lines.
For your understanding,
When you look at the psychrometric chart,
With Wet Bulb Temperature, the angle is wider and the distance between the lines increases proportionally from lower left to upper right.
But,
The Specific Volume increases as the temperature and/or moisture increases.
We have had a detailed understanding of the various properties of air that can be determined graphically on the psychrometric chart.
As said earlier, please remember, if the value of any two properties is known, then all the other properties can be found easily with the help of a psychrometric chart.
